If you use Mikrotik routerboard devices in your networking environment or for remote telemetry applications, you may be interested in retrieving some datapoints from the Routerboard using Mango’s SNMP datasource module.
In this example, I am going to monitor the up/down state of an interface, as well as the DC supply voltage to the routerboard – but of course you can monitor many more things using SNMP, such as interface traffic, temperature, even the number of wireless clients.
Pulling data points like these into Mango makes it possible to do a variety of interesting things. For example, I’m currently hacking together a Mango-based project that will alert me if the front door of my house is left open (via magnetic reed switch), which is a recurring problem. To figure out if anyone’s actually home, Mango will also retrieve the number of connected wireless clients from my home’s wireless access point. When the door is open, but no clients are active (with a bit of additional logic to prevent false alarms) Mango generates an email alert.
..Hey! If you liked this post, you might be interested in these posts too:
First, lets monitor the interface up/down state (running or not running, in RouterOS terminology).
To obtain the relevant SNMP OIDs, you will need to log into your device’s console to access the CLI, and then run the command that to show you the interface table:
/interface print
The output will look something like this:
[admin@Mikrotik] > /interface print
Flags: D - dynamic, X - disabled, R - running, S - slave

NAME TYPE MTU L2MTU MAX-L2MTU MAC-ADDRESS
0 R ether1-ptp ether 1500 1598 4074 4C:5E:0C:39:2F:10
1 RS ether2 ether 1500 1598 4074 4C:5E:0C:39:2F:08
2 RS ether3 ether 1500 1598 4074 4C:5E:0C:39:2F:09
3 RS ether4 ether 1500 1598 4074 4C:5E:0C:39:2F:0A
4 RS ether5 ether 1500 1598 4074 4C:5E:0C:39:2F:0B
5 RS ether6 ether 1500 1598 2028 4C:5E:0C:39:2F:0C
6 RS ether7 ether 1500 1598 2028 4C:5E:0C:39:2F:0D
7 RS ether8 ether 1500 1598 2028 4C:5E:0C:39:2F:0E
8 R ether9 ether 1500 1598 2028 4C:5E:0C:39:2F:0F
9 X ether10 ether 1500 1598 2028 4C:5E:0C:39:2F:10
10 sfp1 ether 1500 1598 4074 4C:5E:0C:39:2F:06
11 R bridge1 bridge 1500 1598 4C:5E:0C:39:2F:0C
12 R pptp-out1 pptp-out 1450
[admin@Mikrotik] >
Make a note of the interface number that you wish to monitor (interface number 0 in my case, for the interface ether1), and now here’s the trick: Run the command again, specifying the additional option oid:
[admin@Mikrotik] > /interface print oid
Flags: D - dynamic, X - disabled, R - running, S - slave
0 R name=.1.3.6.1.2.1.2.2.1.2.2 mtu=.1.3.6.1.2.1.2.2.1.4.2 mac-address=.1.3.6.1.2.1.2.2.1.6.2 admin-status=.1.3.6.1.2.1.2.2.1.7.2
oper-status=.1.3.6.1.2.1.2.2.1.8.2 bytes-in=.1.3.6.1.2.1.31.1.1.1.6.2 packets-in=.1.3.6.1.2.1.31.1.1.1.7.2
discards-in=.1.3.6.1.2.1.2.2.1.13.2 errors-in=.1.3.6.1.2.1.2.2.1.14.2 bytes-out=.1.3.6.1.2.1.31.1.1.1.10.2
packets-out=.1.3.6.1.2.1.31.1.1.1.11.2 discards-out=.1.3.6.1.2.1.2.2.1.19.2 errors-out=.1.3.6.1.2.1.2.2.1.20.2

1 RS name=.1.3.6.1.2.1.2.2.1.2.3 mtu=.1.3.6.1.2.1.2.2.1.4.3 mac-address=.1.3.6.1.2.1.2.2.1.6.3 admin-status=.1.3.6.1.2.1.2.2.1.7.3
oper-status=.1.3.6.1.2.1.2.2.1.8.3 bytes-in=.1.3.6.1.2.1.31.1.1.1.6.3 packets-in=.1.3.6.1.2.1.31.1.1.1.7.3
discards-in=.1.3.6.1.2.1.2.2.1.13.3 errors-in=.1.3.6.1.2.1.2.2.1.14.3 bytes-out=.1.3.6.1.2.1.31.1.1.1.10.3
packets-out=.1.3.6.1.2.1.31.1.1.1.11.3 discards-out=.1.3.6.1.2.1.2.2.1.19.3 errors-out=.1.3.6.1.2.1.2.2.1.20.3

2 RS name=.1.3.6.1.2.1.2.2.1.2.4 mtu=.1.3.6.1.2.1.2.2.1.4.4 mac-address=.1.3.6.1.2.1.2.2.1.6.4 admin-status=.1.3.6.1.2.1.2.2.1.7.4
oper-status=.1.3.6.1.2.1.2.2.1.8.4 bytes-in=.1.3.6.1.2.1.31.1.1.1.6.4 packets-in=.1.3.6.1.2.1.31.1.1.1.7.4
discards-in=.1.3.6.1.2.1.2.2.1.13.4 errors-in=.1.3.6.1.2.1.2.2.1.14.4 bytes-out=.1.3.6.1.2.1.31.1.1.1.10.4
packets-out=.1.3.6.1.2.1.31.1.1.1.11.4 discards-out=.1.3.6.1.2.1.2.2.1.19.4 errors-out=.1.3.6.1.2.1.2.2.1.20.4

3 RS name=.1.3.6.1.2.1.2.2.1.2.5 mtu=.1.3.6.1.2.1.2.2.1.4.5 mac-address=.1.3.6.1.2.1.2.2.1.6.5 admin-status=.1.3.6.1.2.1.2.2.1.7.5
oper-status=.1.3.6.1.2.1.2.2.1.8.5 bytes-in=.1.3.6.1.2.1.31.1.1.1.6.5 packets-in=.1.3.6.1.2.1.31.1.1.1.7.5
discards-in=.1.3.6.1.2.1.2.2.1.13.5 errors-in=.1.3.6.1.2.1.2.2.1.14.5 bytes-out=.1.3.6.1.2.1.31.1.1.1.10.5
packets-out=.1.3.6.1.2.1.31.1.1.1.11.5 discards-out=.1.3.6.1.2.1.2.2.1.19.5 errors-out=.1.3.6.1.2.1.2.2.1.20.5

-- [Q quit|D dump|down]
By quickly comparing this data to the previous, we know that that the SNMP value for interface up/down is called ‘admin-status’, and the SNMP OID for admin-status of interface 0 is .1.3.6.1.2.1.2.2.1.7.2, so now lets create the data source in Mango.
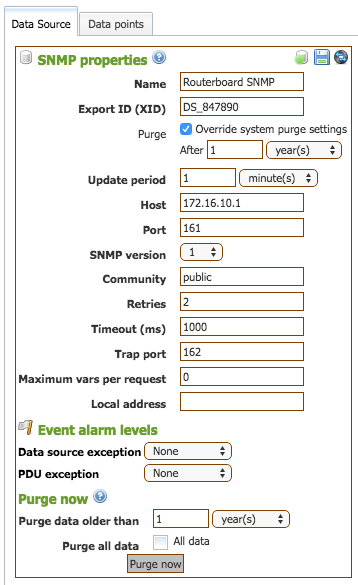
Create a data source of type ‘SNMP’, with the IP address/hostname of your Routerboard device (by the way, all my SNMP traffic here is over a VPN, so for simplicity’s sake I usually leave community set to public – you may not want to):
Now, use the module’s test mode to test the SNMP OID that we found:
Now we can see that a value of ‘1’ corresponds to ‘running‘. If we test an interface that we know is down/disabled, we can see that the value for down/disabled is ‘2’, so now we have everything we need to create the point.
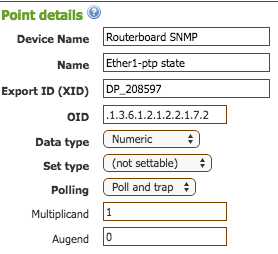
Here’s how I set mine up:
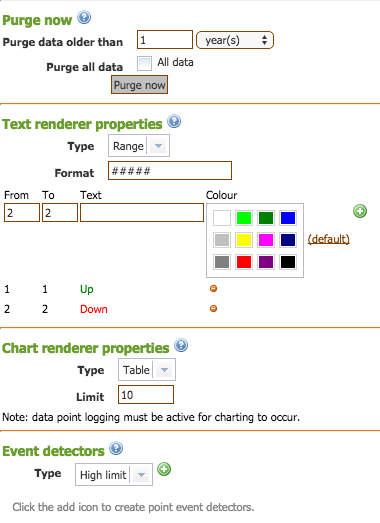
I used the text renderer options to render it as coloured text:
And here’s how that will look in a Watch List:

That was a convoluted example. Here’s a simpler demonstration:
[admin@Mikrotik] > /system health print oid
active-fan: .1.3.6.1.4.1.14988.1.1.3.9.0
voltage: .1.3.6.1.4.1.14988.1.1.3.8.0
temperature: .1.3.6.1.4.1.14988.1.1.3.10.0
processor-temperature: .1.3.6.1.4.1.14988.1.1.3.11.0
current: .1.3.6.1.4.1.14988.1.1.3.13.0
power-consumption: .1.3.6.1.4.1.14988.1.1.3.12.0
psu1-state: .1.3.6.1.4.1.14988.1.1.3.15.0
psu2-state: .1.3.6.1.4.1.14988.1.1.3.16.0
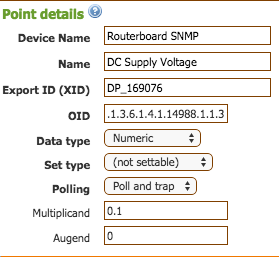
.1.3.6.1.4.1.14988.1.1.3.8.0 is therefore the OID for supply voltage. Test the OID as before and you’ll see it returns an integer.
Here’s how I set my point up, but you can choose different logging/alarming settings:
There are a lot more possibilities using SNMP and RouterOS, especially when you consider Mango Automation’s ability to perform actions based on the conditions of multiple data sources. You could change an HVAC air conditioner’s setpoint based on the temperature of your router, for example (not that you would – but you could). You can even reboot the router and run predefined scripts on it.
Having those extra data-point can be handy in a lot of troubleshooting scenarios, as since it requires no additional hardware, it’s “free”.
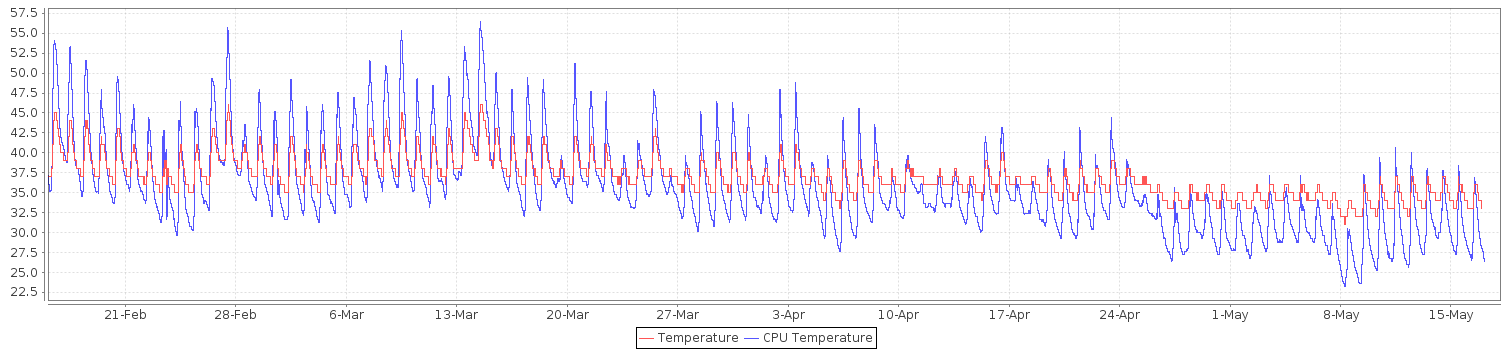
Here’s a chart showing CPU temperatures from a router and a protection relay, both in the same enclosure. Even though we’re recording CPU temperatures, I can now get a good idea of the baseline and the average internal ambient temperature for that enclosure (when the relay’s CPU goes hot but the Routerboard’s does not, I know the internal ambient temperature did not increase, and the temperature rise was localised to that relay).
For more information on SNMP in RouterOS, see here: http://wiki.mikrotik.com/wiki/Manual:SNMP#Object_identifiers_.28OID.29
I hope someone has found this useful. If you did, please post a reply!
Leave a Reply